|
In just a moment, I'll explain why this time may be different. But first, I want to delve into this concept of new highs a little further.
One of my favorite examples of this is a trade we made on Southwest Airlines (NYSE: LUV) for my Maximum Profit service back in the day...
In 2014, Southwest was creating new highs on a near-daily basis. When we entered the trade (in May) the stock was already up 40% on the year. Again, most investors would likely scoff at the idea of buying a stock that's reached a new 52-week high or was up big on the year already.
But that didn't stop us... we entered the trade and rode the stock as it continued to make new 52-week highs. When that momentum stopped, we exited the trade and made a handy 40% gain. For comparison, the S&P 500 returned only 11% over the same time period.

Now I wish I could tell you that since the major indexes recently hit new highs, everything going forward will be hunky-dory. But the truth is I monitor a lot more than just the price action of the S&P 500 and whether it is hitting a new high. If only it was that easy...
In fact, one of my key indicators is telling me otherwise...
A Quick Refresher On The AD Line
One of the indicators I closely monitor in an uptrend is the Advance-Decline Line (AD Line).
I've talked about this indicator numerous times -- most recently in February 2020. Of course, hindsight being 20/20, we now know that the market peaked just a few days days later. We saw a fast and vicious market correction -- a gut-wrenching plummet of over 30% in just a few weeks.
So here's a little refresher on the AD Line... It's a breadth indicator that measures how many stocks are rising compared to falling. I like to think of it as a peek beneath the surface of the market.
You see, when you are in an uptrend you want a lot of market participation, or many stocks that are also reaching new highs. This is a signal that the bull market is healthy, and confirms the bullish trend. However, if the AD Line fails to keep pace with the underlying index, this is a sign of weakness in the market, signaling a bearish divergence.
For example, going all the back to the financial crisis in 2007-2008 we can see two failures (or bearish divergences) in the market.
The first happened in June 2007. The market surged to new highs, but the AD Line didn't. That told us that there wasn't strong participation in the new high. The market pulled back just over 10%.
Then it began to rally going into the fall of 2007 where the market once again hit a new high. But again, the AD Line didn't follow suit, creating another bearish divergence.
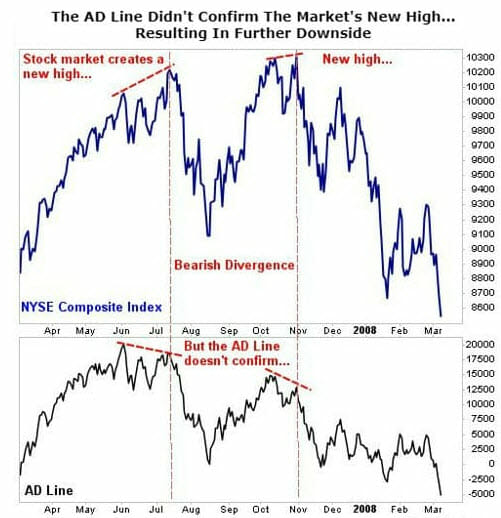
As you can see, the second time we saw a bearish divergence in late 2007 where the market peaked, but the AD Line didn't confirm the bullish trend, the market once again tumbled.
In the fall of 2018, I once again used this breadth indicator to illustrate that there was softness in the bullish trend.
Here's what it looked like then...
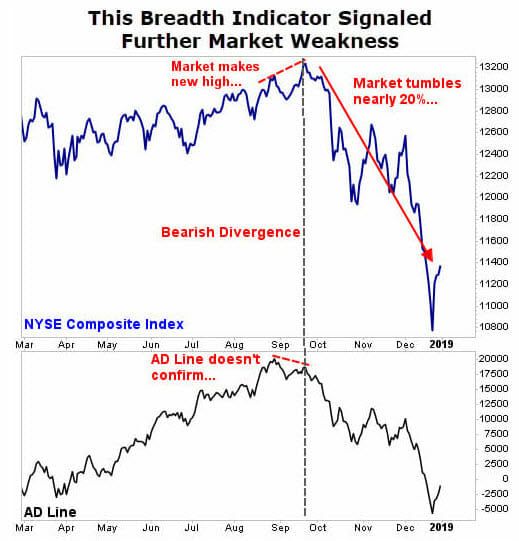
As you can see, in late September with the AD Line failing to confirm the market's recent high, stocks went on to tumble nearly 20%.
Where We Stand Today
Now here's where we are at today...

Now, I do want to point out something important. Like most indicators, this one isn't bulletproof. With that being said, it does have a darn good track record.
But considering that this breadth indicator is flashing warning signs that a correction is on the horizon, it pays keep an extra close eye on your stocks. I'm going to be watching this indicator closely in the days to come for more insight.
If this turns out to be a head fake, then I'll certainly look to add to my portfolio in the future. I'm going to remain cautious in my approach to the market for the time being, and I suggest you do the same.
In the meantime, I have a question to ask you...
Wouldn't it be nice to have some holdings in your portfolio that would allow you to sleep at night? That's where my colleague Nathan Slaughter's latest research comes in...
Nathan just released a brand-new report on 5 "Bulletproof" stocks that have a proven track record of holding up in any market. These stocks enrich shareholders year after year -- delivering a powerful combination of capital gains and dividend increases. Even better, after an incredible bull market, they still yield more than 5% right now -- and all of them are "buys" today.
Go here to learn how to get your hands on these picks now.
| 

